
前面介绍了Tidb各个组件的详细情况,最终还是要所见即所得,所以这里咱们演示下TiDB的部署,目前TiDB主流的部署方案主要有两种,分别是:
1、通过tiup进行部署
2、通过k8s进行部署
这我们主要演示使用tiup进行部署。下面直接开始。
一、环境准备
tidb对于服务器的部署要求没那么高,所以在测试环境一般2C2G的服务器都可以部署出来,但是在生产上为了发挥Tidb的性能,还是需要尽可能的选择高配的服务器,毕竟生产上的数据库服务器配置都不能低,这是硬性要求。
二、安装tiup
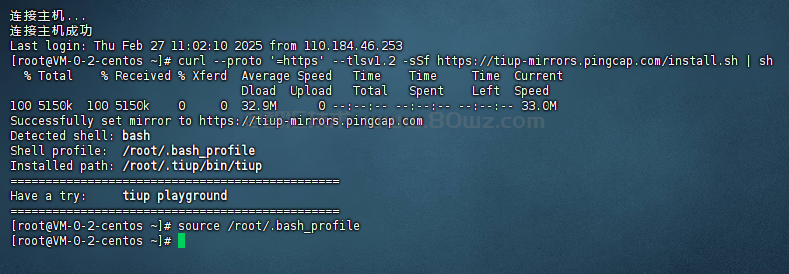
tiup是tidb4.0版本开始引入的集群运维工具,截至到今天,Tidb最新的版本已经是8.5版本了,所以tiup工具是完全可以部署最新版本的,日常中通过tiup这个集群运维工具,可以进行包括不仅限于:部署,启动,关闭,销毁,弹性扩容,弹性所容,升级Tidb集群,管理Tidb集群参数等操作,是不是很方便?安装tiup工具也很简单,使用如下的命令即可安装:
#安装tiup
curl --proto '=https' --tlsv1.2 -sSf https://tiup-mirrors.pingcap.com/install.sh | sh

#执行环境变量
source /root/.bash_profile
如下图:
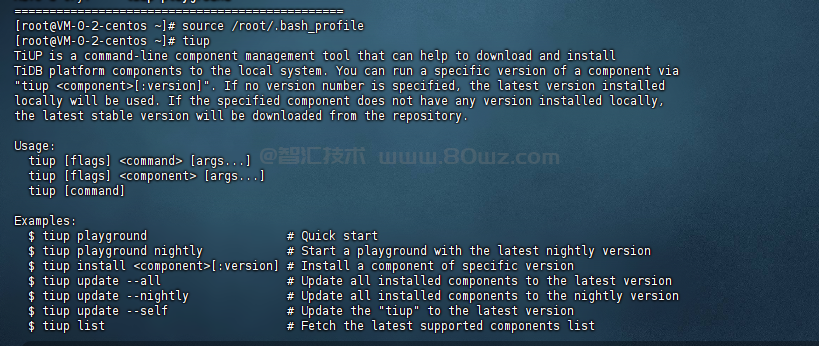
安装完成之后,就可以使用tiup命令了,如下图:
三、配置ssh免密码登录
详见《配置ssh免密码登录》
注意:
1、这里如果部署集群的话,不止配置本机的ssh免密码登录,还要配置服务器与服务器之间的ssh免密码登录。
四、部署tidb
这里是测试环境,所以我们只有一台服务器,那么我们就把所有的组件都部署在这台服务器上,这里暂时不掩饰OLAP相关的场景,所以暂时只部署PD,tidb server、Tikv这三个组件即可。
1)生成模板
这里我们需要使用tiup命令来生成一个模板,对应的命令如下:
#在当前用户的根目录生成一个模板文件
tiup cluster template > ~/topology.yaml
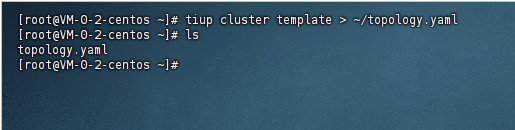
这里他会自动去网上下载最新的模板,然后clone下来,由于我已经下载过,所以这里没有下载的日志了,会直接生成最新的模板。生成之后,在根目录即可看到这个topology.yaml的文件,这就是我们在后面需要使用到的模板文件。
2)修改模板
这里使用编辑器打开topology.yaml文件,看到如下的内容:
# # Global variables are applied to all deployments and used as the default value of
# # the deployments if a specific deployment value is missing.
global:
  # # The user who runs the tidb cluster.
  user: "tidb"
  # # group is used to specify the group name the user belong to if it's not the same as user.
  # group: "tidb"
  # # systemd_mode is used to select whether to use sudo permissions. When its value is set to user, there is no need to add global.user to sudoers. The default value is system.
  # systemd_mode: "system"
  # # SSH port of servers in the managed cluster.
  ssh_port: 22
  # # Storage directory for cluster deployment files, startup scripts, and configuration files.
  deploy_dir: "/tidb-deploy"
  # # TiDB Cluster data storage directory
  data_dir: "/tidb-data"
  # # default listen_host for all components
  listen_host: 0.0.0.0
  # # Supported values: "amd64", "arm64" (default: "amd64")
  arch: "amd64"
  # # Resource Control is used to limit the resource of an instance.
  # # See: https://www.freedesktop.org/software/systemd/man/systemd.resource-control.html
  # # Supports using instance-level `resource_control` to override global `resource_control`.
  # resource_control:
  #   # See: https://www.freedesktop.org/software/systemd/man/systemd.resource-control.html#MemoryLimit=bytes
  #   memory_limit: "2G"
  #   # See: https://www.freedesktop.org/software/systemd/man/systemd.resource-control.html#CPUQuota=
  #   # The percentage specifies how much CPU time the unit shall get at maximum, relative to the total CPU time available on one CPU. Use values > 100% for allotting CPU time on more than one CPU.
  #   # Example: CPUQuota=200% ensures that the executed processes will never get more than two CPU time.
  #   cpu_quota: "200%"
  #   # See: https://www.freedesktop.org/software/systemd/man/systemd.resource-control.html#IOReadBandwidthMax=device%20bytes
  #   io_read_bandwidth_max: "/dev/disk/by-path/pci-0000:00:1f.2-scsi-0:0:0:0 100M"
  #   io_write_bandwidth_max: "/dev/disk/by-path/pci-0000:00:1f.2-scsi-0:0:0:0 100M"

# # Monitored variables are applied to all the machines.
monitored:
  # # The communication port for reporting system information of each node in the TiDB cluster.
  node_exporter_port: 9100
  # # Blackbox_exporter communication port, used for TiDB cluster port monitoring.
  blackbox_exporter_port: 9115
  # # Storage directory for deployment files, startup scripts, and configuration files of monitoring components.
  # deploy_dir: "/tidb-deploy/monitored-9100"
  # # Data storage directory of monitoring components.
  # data_dir: "/tidb-data/monitored-9100"
  # # Log storage directory of the monitoring component.
  # log_dir: "/tidb-deploy/monitored-9100/log"

# # Server configs are used to specify the runtime configuration of TiDB components.
# # All configuration items can be found in TiDB docs:
# # - TiDB: https://docs.pingcap.com/tidb/stable/tidb-configuration-file
# # - TiKV: https://docs.pingcap.com/tidb/stable/tikv-configuration-file
# # - PD: https://docs.pingcap.com/tidb/stable/pd-configuration-file
# # - TiFlash: https://docs.pingcap.com/tidb/stable/tiflash-configuration
# #
# # All configuration items use points to represent the hierarchy, e.g:
# #   readpool.storage.use-unified-pool
# #           ^       ^
# # - example: https://github.com/pingcap/tiup/blob/master/examples/topology.example.yaml.
# # You can overwrite this configuration via the instance-level `config` field.
# server_configs:
  # tidb:
  # tikv:
  # pd:
  # tiflash:
  # tiflash-learner:

# # Server configs are used to specify the configuration of PD Servers.
pd_servers:
  # # The ip address of the PD Server.
  - host: 10.0.1.11
    # # SSH port of the server.
    # ssh_port: 22
    # # PD Server name
    # name: "pd-1"
    # # communication port for TiDB Servers to connect.
    # client_port: 2379
    # # Communication port among PD Server nodes.
    # peer_port: 2380
    # # PD Server deployment file, startup script, configuration file storage directory.
    # deploy_dir: "/tidb-deploy/pd-2379"
    # # PD Server data storage directory.
    # data_dir: "/tidb-data/pd-2379"
    # # PD Server log file storage directory.
    # log_dir: "/tidb-deploy/pd-2379/log"
    # # numa node bindings.
    # numa_node: "0,1"
    # # The following configs are used to overwrite the `server_configs.pd` values.
    # config:
    #   schedule.max-merge-region-size: 20
    #   schedule.max-merge-region-keys: 200000
  - host: 10.0.1.12
    # ssh_port: 22
    # name: "pd-1"
    # client_port: 2379
    # peer_port: 2380
    # deploy_dir: "/tidb-deploy/pd-2379"
    # data_dir: "/tidb-data/pd-2379"
    # log_dir: "/tidb-deploy/pd-2379/log"
    # numa_node: "0,1"
    # config:
    #   schedule.max-merge-region-size: 20
    #   schedule.max-merge-region-keys: 200000
  - host: 10.0.1.13
    # ssh_port: 22
    # name: "pd-1"
    # client_port: 2379
    # peer_port: 2380
    # deploy_dir: "/tidb-deploy/pd-2379"
    # data_dir: "/tidb-data/pd-2379"
    # log_dir: "/tidb-deploy/pd-2379/log"
    # numa_node: "0,1"
    # config:
    #   schedule.max-merge-region-size: 20
    #   schedule.max-merge-region-keys: 200000

# # Server configs are used to specify the configuration of TiDB Servers.
tidb_servers:
  # # The ip address of the TiDB Server.
  - host: 10.0.1.14
    # # SSH port of the server.
    # ssh_port: 22
    # # The port for clients to access the TiDB cluster.
    # port: 4000
    # # TiDB Server status API port.
    # status_port: 10080
    # # TiDB Server deployment file, startup script, configuration file storage directory.
    # deploy_dir: "/tidb-deploy/tidb-4000"
    # # TiDB Server log file storage directory.
    # log_dir: "/tidb-deploy/tidb-4000/log"
  # # The ip address of the TiDB Server.
  - host: 10.0.1.15
    # ssh_port: 22
    # port: 4000
    # status_port: 10080
    # deploy_dir: "/tidb-deploy/tidb-4000"
    # log_dir: "/tidb-deploy/tidb-4000/log"
  - host: 10.0.1.16
    # ssh_port: 22
    # port: 4000
    # status_port: 10080
    # deploy_dir: "/tidb-deploy/tidb-4000"
    # log_dir: "/tidb-deploy/tidb-4000/log"

# # Server configs are used to specify the configuration of TiKV Servers.
tikv_servers:
  # # The ip address of the TiKV Server.
  - host: 10.0.1.17
    # # SSH port of the server.
    # ssh_port: 22
    # # TiKV Server communication port.
    # port: 20160
    # # TiKV Server status API port.
    # status_port: 20180
    # # TiKV Server deployment file, startup script, configuration file storage directory.
    # deploy_dir: "/tidb-deploy/tikv-20160"
    # # TiKV Server data storage directory.
    # data_dir: "/tidb-data/tikv-20160"
    # # TiKV Server log file storage directory.
    # log_dir: "/tidb-deploy/tikv-20160/log"
    # # The following configs are used to overwrite the `server_configs.tikv` values.
    # config:
    #   log.level: warn
  # # The ip address of the TiKV Server.
  - host: 10.0.1.18
    # ssh_port: 22
    # port: 20160
    # status_port: 20180
    # deploy_dir: "/tidb-deploy/tikv-20160"
    # data_dir: "/tidb-data/tikv-20160"
    # log_dir: "/tidb-deploy/tikv-20160/log"
    # config:
    #   log.level: warn
  - host: 10.0.1.19
    # ssh_port: 22
    # port: 20160
    # status_port: 20180
    # deploy_dir: "/tidb-deploy/tikv-20160"
    # data_dir: "/tidb-data/tikv-20160"
    # log_dir: "/tidb-deploy/tikv-20160/log"
    # config:
    #   log.level: warn

# # Server configs are used to specify the configuration of TiFlash Servers.
tiflash_servers:
  # # The ip address of the TiFlash Server.
  - host: 10.0.1.20
    # # SSH port of the server.
    # ssh_port: 22
    # # TiFlash TCP Service port.
    # # Since 7.1.0, it is not actually listened, and only being used as part of the instance identity.
    # tcp_port: 9000
    # # TiFlash raft service and coprocessor service listening address.
    # flash_service_port: 3930
    # # TiFlash Proxy service port.
    # flash_proxy_port: 20170
    # # TiFlash Proxy metrics port.
    # flash_proxy_status_port: 20292
    # # TiFlash metrics port.
    # metrics_port: 8234
    # # TiFlash Server deployment file, startup script, configuration file storage directory.
    # deploy_dir: /tidb-deploy/tiflash-9000
    ## With cluster version >= v4.0.9 and you want to deploy a multi-disk TiFlash node, it is recommended to
    ## check config.storage.* for details. The data_dir will be ignored if you defined those configurations.
    ## Setting data_dir to a ','-joined string is still supported but deprecated.
    ## Check https://docs.pingcap.com/tidb/stable/tiflash-configuration#multi-disk-deployment for more details.
    # # TiFlash Server data storage directory.
    # data_dir: /tidb-data/tiflash-9000
    # # TiFlash Server log file storage directory.
    # log_dir: /tidb-deploy/tiflash-9000/log
  # # The ip address of the TiKV Server.
  - host: 10.0.1.21
    # ssh_port: 22
    # tcp_port: 9000
    # flash_service_port: 3930
    # flash_proxy_port: 20170
    # flash_proxy_status_port: 20292
    # metrics_port: 8234
    # deploy_dir: /tidb-deploy/tiflash-9000
    # data_dir: /tidb-data/tiflash-9000
    # log_dir: /tidb-deploy/tiflash-9000/log

# # Server configs are used to specify the configuration of Prometheus Server.
monitoring_servers:
  # # The ip address of the Monitoring Server.
  - host: 10.0.1.22
    # # SSH port of the server.
    # ssh_port: 22
    # # Prometheus Service communication port.
    # port: 9090
    # # ng-monitoring servive communication port
    # ng_port: 12020
    # # Prometheus deployment file, startup script, configuration file storage directory.
    # deploy_dir: "/tidb-deploy/prometheus-8249"
    # # Prometheus data storage directory.
    # data_dir: "/tidb-data/prometheus-8249"
    # # Prometheus log file storage directory.
    # log_dir: "/tidb-deploy/prometheus-8249/log"

# # Server configs are used to specify the configuration of Grafana Servers.
grafana_servers:
  # # The ip address of the Grafana Server.
  - host: 10.0.1.22
    # # Grafana web port (browser access)
    # port: 3000
    # # Grafana deployment file, startup script, configuration file storage directory.
    # deploy_dir: /tidb-deploy/grafana-3000

# # Server configs are used to specify the configuration of Alertmanager Servers.
alertmanager_servers:
  # # The ip address of the Alertmanager Server.
  - host: 10.0.1.22
    # # SSH port of the server.
    # ssh_port: 22
    # # Alertmanager web service port.
    # web_port: 9093
    # # Alertmanager communication port.
    # cluster_port: 9094
    # # Alertmanager deployment file, startup script, configuration file storage directory.
    # deploy_dir: "/tidb-deploy/alertmanager-9093"
    # # Alertmanager data storage directory.
    # data_dir: "/tidb-data/alertmanager-9093"
    # # Alertmanager log file storage directory.
    # log_dir: "/tidb-deploy/alertmanager-9093/log"
在上面的配置文件中我们根据自己的情况进行修改即可,以下是我们修改后的文件内容:
# # Global variables are applied to all deployments and used as the default value of
# # the deployments if a specific deployment value is missing.
global:
  # # The user who runs the tidb cluster.
  user: "tidb"
  # # group is used to specify the group name the user belong to if it's not the same as user.
  # group: "tidb"
  # # systemd_mode is used to select whether to use sudo permissions. When its value is set to user, there is no need to add global.user to sudoers. The default value is system.
  # systemd_mode: "system"
  # # SSH port of servers in the managed cluster.
  ssh_port: 22
  # # Storage directory for cluster deployment files, startup scripts, and configuration files.
  deploy_dir: "/home/pubserver/tidb_deploy"
  # # TiDB Cluster data storage directory
  data_dir: "/home/pubserver/tidb_data"
  # # default listen_host for all components
  listen_host: 0.0.0.0
  # # Supported values: "amd64", "arm64" (default: "amd64")
  arch: "amd64"
  # # Resource Control is used to limit the resource of an instance.
  # # See: https://www.freedesktop.org/software/systemd/man/systemd.resource-control.html
  # # Supports using instance-level `resource_control` to override global `resource_control`.
  # resource_control:
  #   # See: https://www.freedesktop.org/software/systemd/man/systemd.resource-control.html#MemoryLimit=bytes
  #   memory_limit: "2G"
  #   # See: https://www.freedesktop.org/software/systemd/man/systemd.resource-control.html#CPUQuota=
  #   # The percentage specifies how much CPU time the unit shall get at maximum, relative to the total CPU time available on one CPU. Use values > 100% for allotting CPU time on more than one CPU.
  #   # Example: CPUQuota=200% ensures that the executed processes will never get more than two CPU time.
  #   cpu_quota: "200%"
  #   # See: https://www.freedesktop.org/software/systemd/man/systemd.resource-control.html#IOReadBandwidthMax=device%20bytes
  #   io_read_bandwidth_max: "/dev/disk/by-path/pci-0000:00:1f.2-scsi-0:0:0:0 100M"
  #   io_write_bandwidth_max: "/dev/disk/by-path/pci-0000:00:1f.2-scsi-0:0:0:0 100M"

# # Monitored variables are applied to all the machines.
monitored:
  # # The communication port for reporting system information of each node in the TiDB cluster.
  node_exporter_port: 9100
  # # Blackbox_exporter communication port, used for TiDB cluster port monitoring.
  blackbox_exporter_port: 9115
  # # Storage directory for deployment files, startup scripts, and configuration files of monitoring components.
  # deploy_dir: "/tidb-deploy/monitored-9100"
  # # Data storage directory of monitoring components.
  # data_dir: "/tidb-data/monitored-9100"
  # # Log storage directory of the monitoring component.
  # log_dir: "/tidb-deploy/monitored-9100/log"

# # Server configs are used to specify the runtime configuration of TiDB components.
# # All configuration items can be found in TiDB docs:
# # - TiDB: https://docs.pingcap.com/tidb/stable/tidb-configuration-file
# # - TiKV: https://docs.pingcap.com/tidb/stable/tikv-configuration-file
# # - PD: https://docs.pingcap.com/tidb/stable/pd-configuration-file
# # - TiFlash: https://docs.pingcap.com/tidb/stable/tiflash-configuration
# #
# # All configuration items use points to represent the hierarchy, e.g:
# #   readpool.storage.use-unified-pool
# #           ^       ^
# # - example: https://github.com/pingcap/tiup/blob/master/examples/topology.example.yaml.
# # You can overwrite this configuration via the instance-level `config` field.
# server_configs:
  # tidb:
  # tikv:
  # pd:
  # tiflash:
  # tiflash-learner:

# # Server configs are used to specify the configuration of PD Servers.
pd_servers:
  # # The ip address of the PD Server.
  - host: 172.19.0.2
    # # SSH port of the server.
    ssh_port: 22
    # # PD Server name
    name: "pd-1"
    # # communication port for TiDB Servers to connect.
    client_port: 2379
    # # Communication port among PD Server nodes.
    peer_port: 2380
    # # PD Server deployment file, startup script, configuration file storage directory.
    deploy_dir: "/home/pubserver/tidb_deploy/pd-2379"
    # # PD Server data storage directory.
    data_dir: "/home/pubserver/tidb_data/pd-2379"
    # # PD Server log file storage directory.
    log_dir: "/home/pubserver/tidb_deploy/pd-2379/log"
    # # numa node bindings.
    # numa_node: "0,1"
    # # The following configs are used to overwrite the `server_configs.pd` values.
    # config:
    #   schedule.max-merge-region-size: 20
    #   schedule.max-merge-region-keys: 200000
# # Server configs are used to specify the configuration of TiDB Servers.
tidb_servers:
  # # The ip address of the TiDB Server.
  - host: 172.19.0.2
    # # SSH port of the server.
    ssh_port: 22
    # # The port for clients to access the TiDB cluster.
    port: 4000
    # # TiDB Server status API port.
    status_port: 10080
    # # TiDB Server deployment file, startup script, configuration file storage directory.
    deploy_dir: "/home/pubserver/tidb_deploy/tidb-4000"
    # # TiDB Server log file storage directory.
    log_dir: "/home/pubserver/tidb_deploy/tidb-4000/log"

# # Server configs are used to specify the configuration of TiKV Servers.
tikv_servers:
  # # The ip address of the TiKV Server.
  - host: 172.19.0.2
    # # SSH port of the server.
    ssh_port: 22
    # # TiKV Server communication port.
    port: 20160
    # # TiKV Server status API port.
    status_port: 20180
    # # TiKV Server deployment file, startup script, configuration file storage directory.
    deploy_dir: "/home/pubserver/tidb_deploy/tikv-20160"
    # # TiKV Server data storage directory.
    data_dir: "/home/pubserver/tidb_data/tikv-20160"
    # # TiKV Server log file storage directory.
    log_dir: "/home/pubserver/tidb_deploy/tikv-20160/log"
    # # The following configs are used to overwrite the `server_configs.tikv` values.
    # config:
    #   log.level: warn

# # Server configs are used to specify the configuration of TiFlash Servers.
tiflash_servers:
  # # The ip address of the TiFlash Server.
  #- host: 10.0.1.20
    # # SSH port of the server.
    # ssh_port: 22
    # # TiFlash TCP Service port.
    # # Since 7.1.0, it is not actually listened, and only being used as part of the instance identity.
    # tcp_port: 9000
    # # TiFlash raft service and coprocessor service listening address.
    # flash_service_port: 3930
    # # TiFlash Proxy service port.
    # flash_proxy_port: 20170
    # # TiFlash Proxy metrics port.
    # flash_proxy_status_port: 20292
    # # TiFlash metrics port.
    # metrics_port: 8234
    # # TiFlash Server deployment file, startup script, configuration file storage directory.
    # deploy_dir: /tidb-deploy/tiflash-9000
    ## With cluster version >= v4.0.9 and you want to deploy a multi-disk TiFlash node, it is recommended to
    ## check config.storage.* for details. The data_dir will be ignored if you defined those configurations.
    ## Setting data_dir to a ','-joined string is still supported but deprecated.
    ## Check https://docs.pingcap.com/tidb/stable/tiflash-configuration#multi-disk-deployment for more details.
    # # TiFlash Server data storage directory.
    # data_dir: /tidb-data/tiflash-9000
    # # TiFlash Server log file storage directory.
    # log_dir: /tidb-deploy/tiflash-9000/log

# # Server configs are used to specify the configuration of Prometheus Server.
monitoring_servers:
  # # The ip address of the Monitoring Server.
  - host: 172.19.0.2
    # # SSH port of the server.
    # ssh_port: 22
    # # Prometheus Service communication port.
    # port: 9090
    # # ng-monitoring servive communication port
    # ng_port: 12020
    # # Prometheus deployment file, startup script, configuration file storage directory.
    deploy_dir: "/home/pubserver/tidb_deploy/prometheus-8249"
    # # Prometheus data storage directory.
    data_dir: "/home/pubserver/tidb_data/prometheus-8249"
    # # Prometheus log file storage directory.
    log_dir: "/home/pubserver/tidb_deploy/prometheus-8249/log"

# # Server configs are used to specify the configuration of Grafana Servers.
grafana_servers:
  # # The ip address of the Grafana Server.
  - host: 172.19.0.2
    # # Grafana web port (browser access)
    # port: 3000
    # # Grafana deployment file, startup script, configuration file storage directory.
    deploy_dir: /home/pubserver/tidb_deploy/grafana-3000

# # Server configs are used to specify the configuration of Alertmanager Servers.
alertmanager_servers:
  # # The ip address of the Alertmanager Server.
  - host: 172.19.0.2
    # # SSH port of the server.
    # ssh_port: 22
    # # Alertmanager web service port.
    # web_port: 9093
    # # Alertmanager communication port.
    # cluster_port: 9094
    # # Alertmanager deployment file, startup script, configuration file storage directory.
    deploy_dir: "/home/pubserver/tidb_deploy/alertmanager-9093"
    # # Alertmanager data storage directory.
    data_dir: "/home/pubserver/tidb_data/alertmanager-9093"
    # # Alertmanager log file storage directory.
    log_dir: "/home/pubserver/tidb_deploy/alertmanager-9093/log"
这里我们只是配置单机版本的安装即可,集群的话,在对应角色组件下添加对应的服务器信息即可。配置完成之后,我们再检测一下配置文件是否正确。
#检查配置
tiup cluster check ~/topology.yaml
如下图:
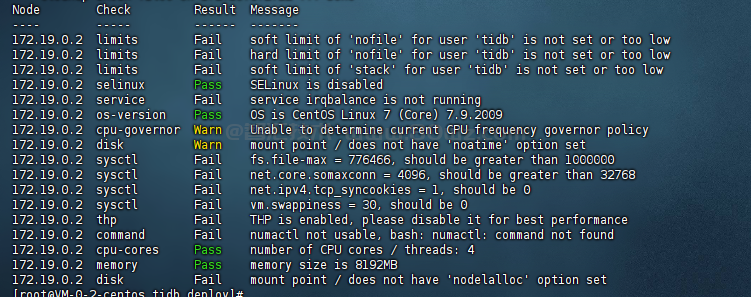
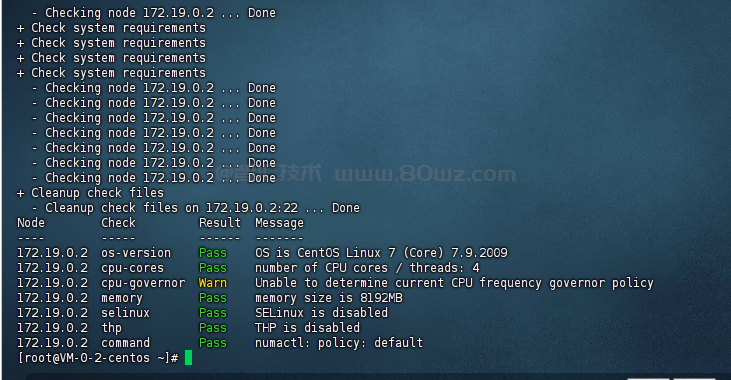
我们可以看到很多Fail状态的检查项,如果出现Fail,那么挨个解决即可。解决后再继续检查,直到没有出现Fail为止:
备注:
1、这里可能会出现很多fail,如果是centos的话,可参考《tidb环境配置》进行修改即可。
3)部署tidb集群
接下来就使用前面的配置文件部署tidb了,执行如下的命令:
#部署tidb V8.5版本
tiup cluster deploy tidb-test v8.5.1 ~/topology.yaml
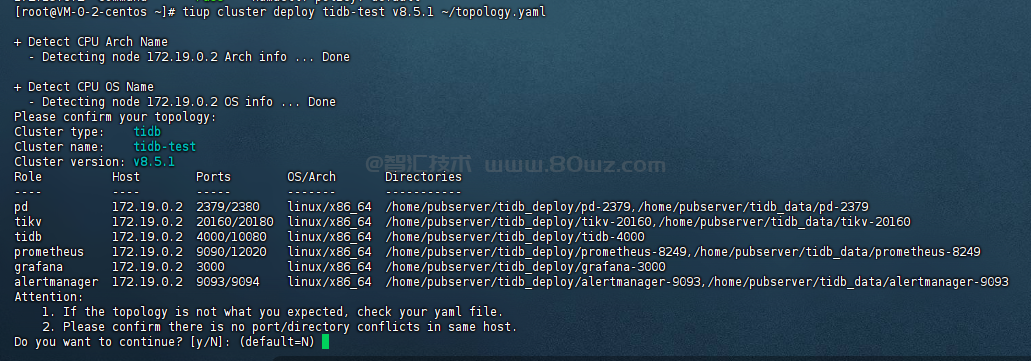
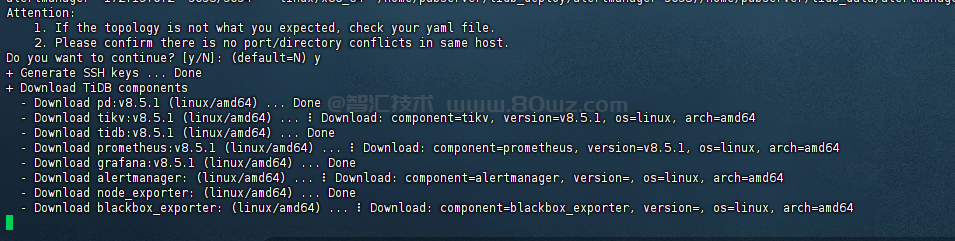
执行之后会,填入Y即可,他就会开始下载:
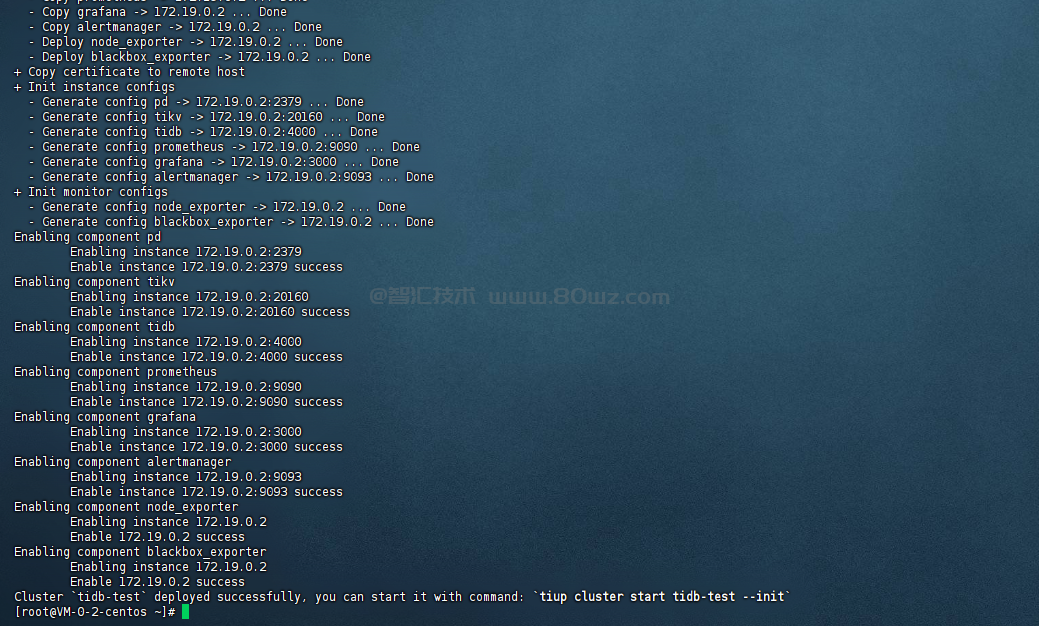
当出现如下的界面就代表安装完成了:
备注:
1、在生产上,咱们肯定是不能使用tidb-test这样的集群名称的,所以在这里就需要把集群名称给修改了。不然后面只能自己改了。
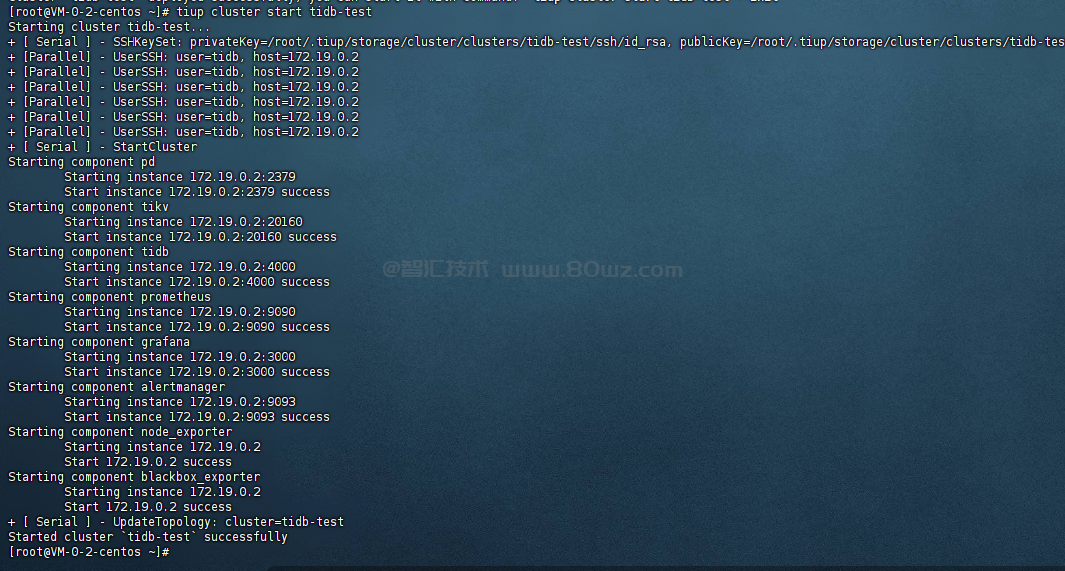
4)启动tidb集群
上面安装完成之后,tidb集群是没有启动的,所以这里要启动以下整个tidb集群,启动有两种方式,分别是不生成root密码和生成root密码,示例如下:
#不生成root密码,普通启动
tiup cluster start tidb-test

#生成root密码,安全启动
tiup cluster start tidb-test --init
由于是测试环境,所以这里我们选择不设工程密码启动:
5)体验tidb集群
接下来就可以体验整个tidb集群了,示例如下:
a)查看tidb集群状态
tiup cluster display tidb-test

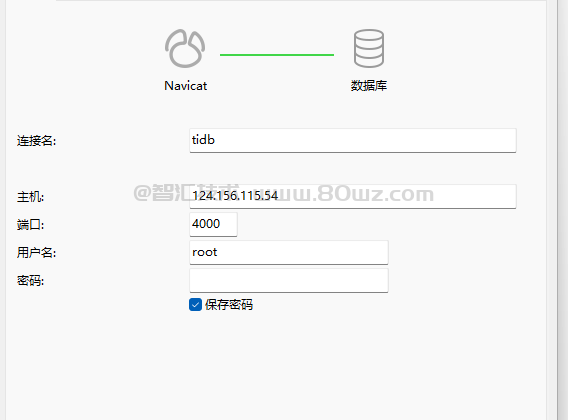
b)使用mysql 客户端链接tidb
由于没有密码,所以直接不输入密码即可:
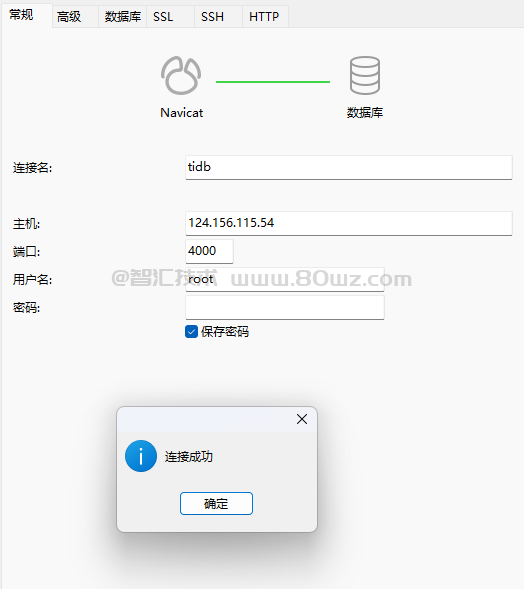
测试能连接成功
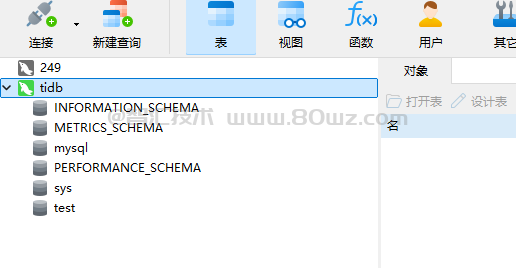
连接上去的样子:
c)查看tidb的dashboard
这里的访问端口是:2379,所以在浏览器地址上输入:
http://ip:2379/dashboard/#/signin
访问后即会出现登录界面:
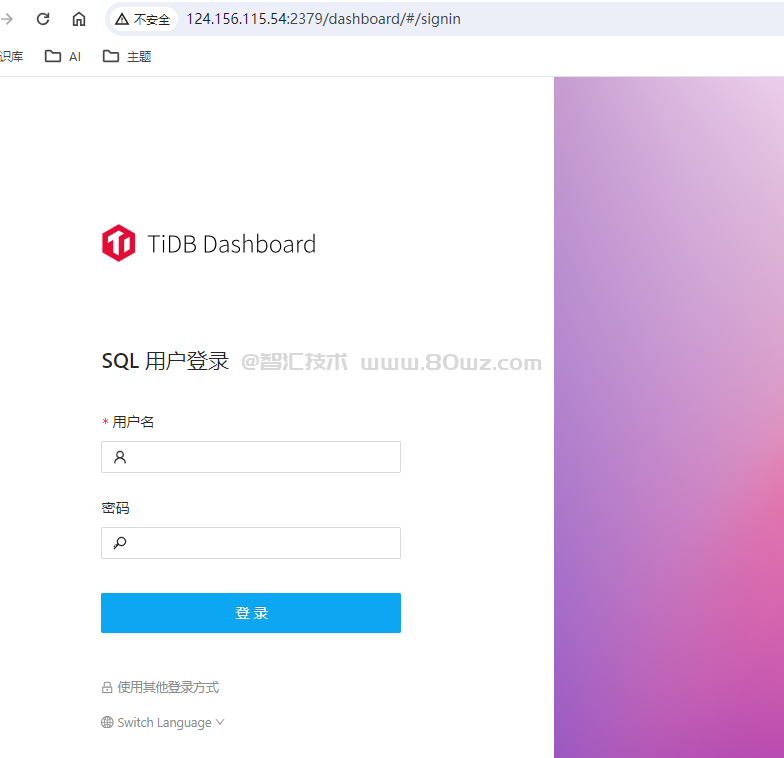
这里输入用户名root后就登录进来了(前面我们没有设置密码)。
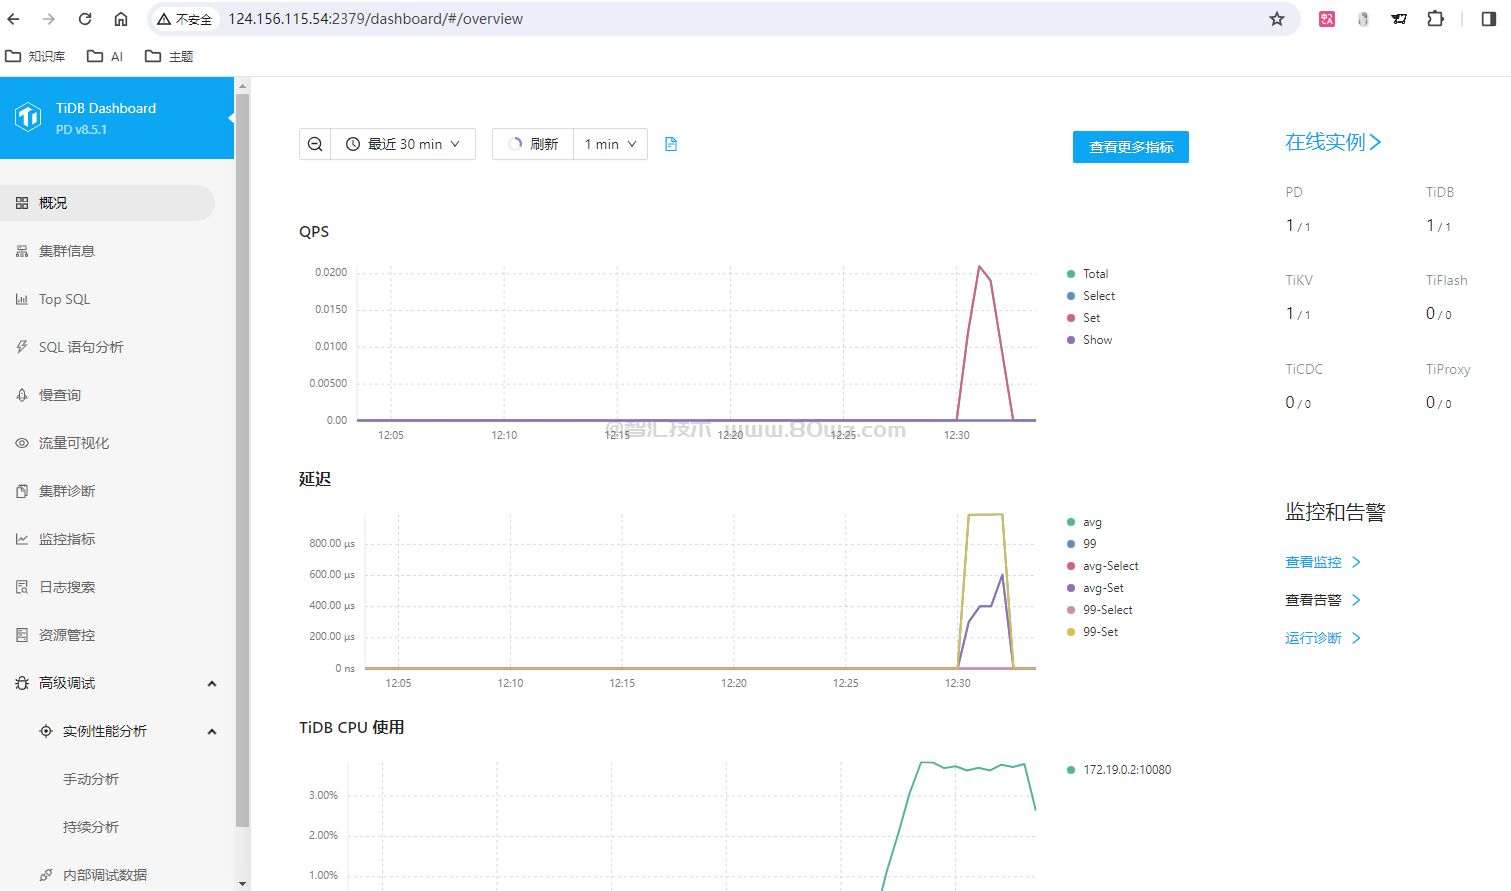
界面上可以看到很多东西。我们将在下一篇文章介绍。
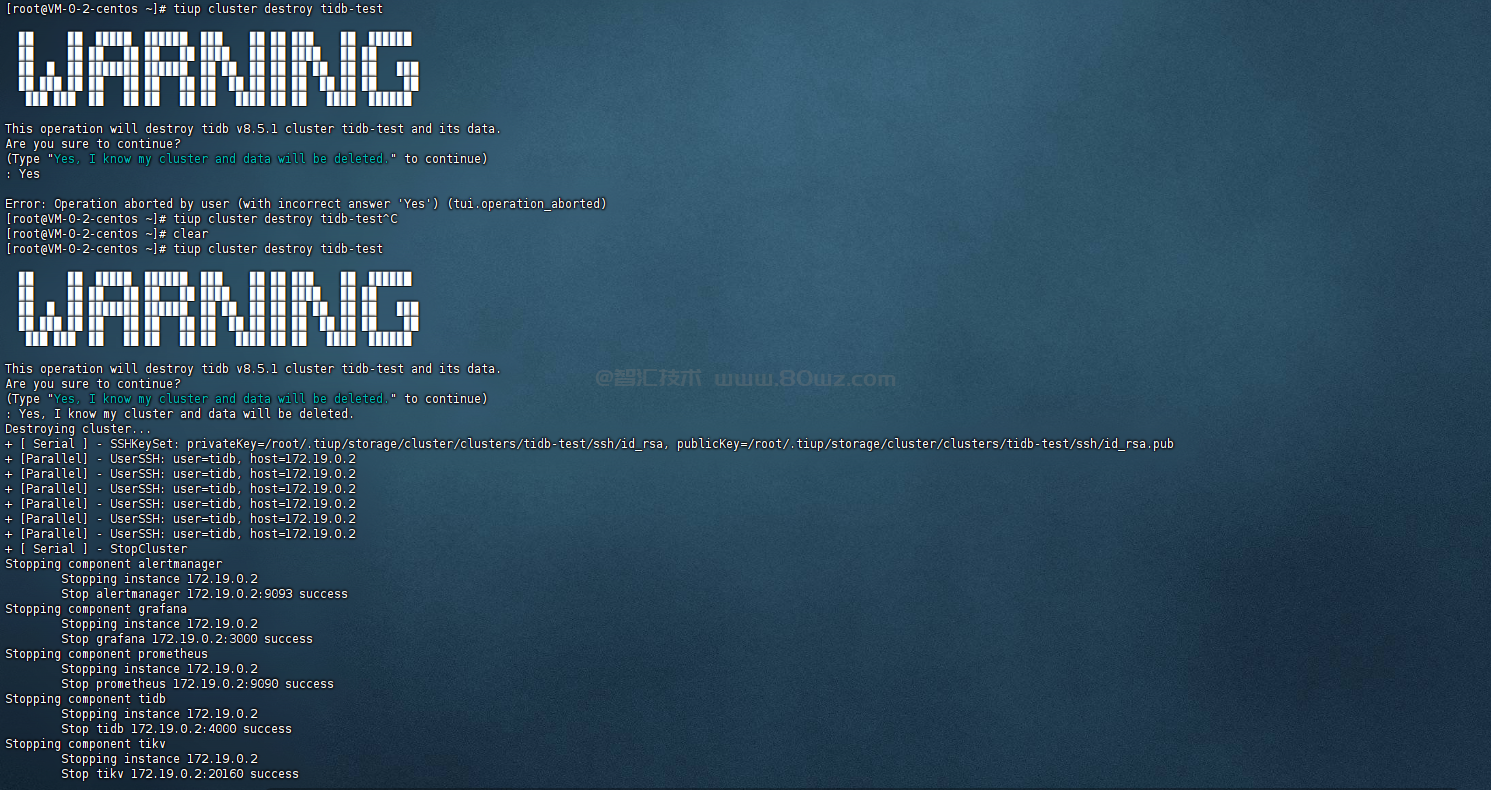
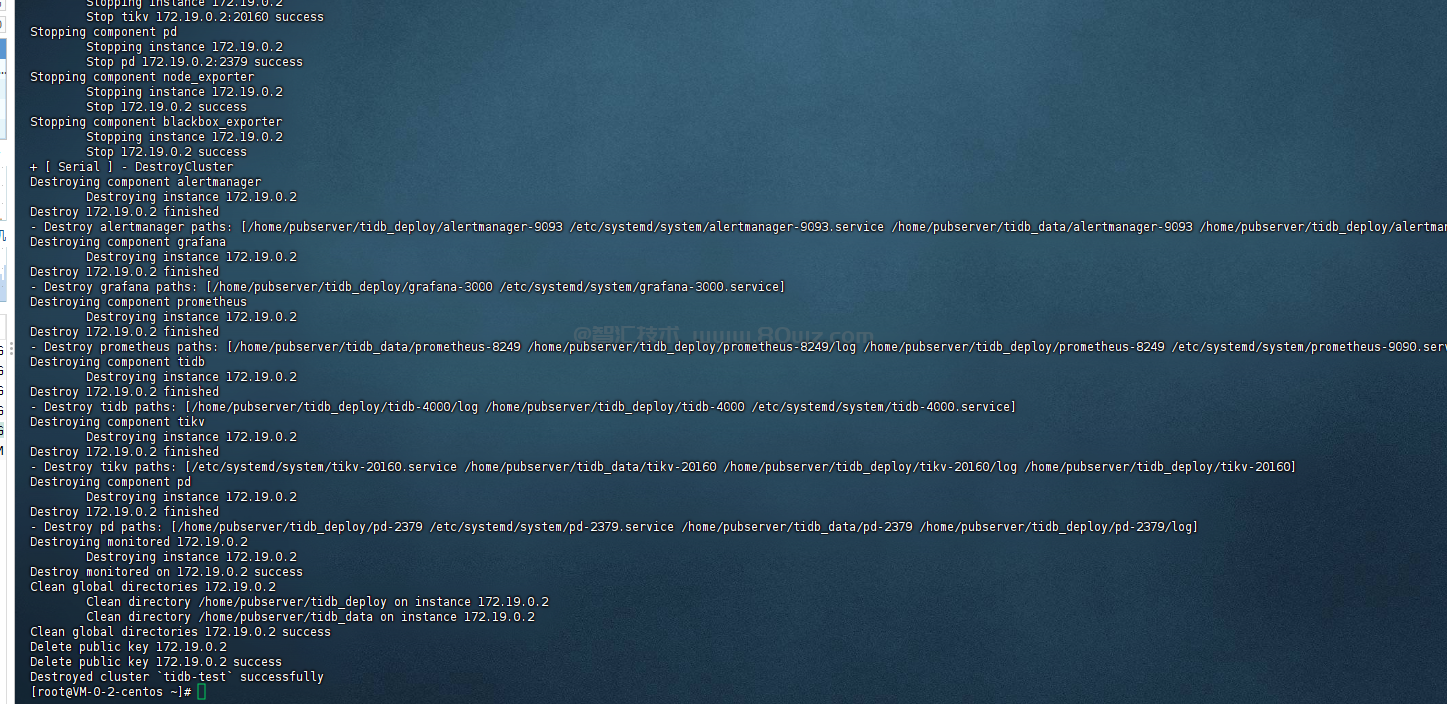
d)清理集群
这里如果不想用这里的test集群了,可以把他给清理掉,示例如下:
tiup cluster destroy tidb-test
在完成tidb部署的时候,我们启动命令使用的是:tiup cluster start tidb-test。在生产上咱们肯定是不会使用tidb-test这个名称了,那么如何修改这里的tidb-test名称了。如果不小心使用了tidb-test这个名称作为了tidb的集群,比较好的办法就是清除掉整个tidb-test集群,然后使用
tiup cluster deploy ${新名称} v8.5.1 ./topology.yaml重新部署启动就好了。


还没有评论,来说两句吧...