
在前面的文章,我们分别介绍了springboot日志的统一打印,logtash的日志收集、elasticsearch的安装。今天我们来介绍下kibana的搭建,目的是我们可以直接在kibana里面进行日志的可视化查询。下面直接进入正题
1、环境准备
在前面我们介绍了logtash、elasticsearch需要使用统一的版本号,因此这里的kibana我们也需要使用对应的版本号。这里我们还是使用kibana 7.7.0版本。下载地址是:https://www.elastic.co/cn/downloads/

这里我们已经下载了。
2、配置kibana
配置kibana的话,这里主要是配置kibana文件夹config目录下的kibana.yml文件。此文件主要修改点有2个,分别是:
elasticsearch.hosts: ["http://192.168.31.20:9200"]
这个是配置kibana连接哪个elasticsearch
server.host: "192.168.31.20"
这个是配置kibana的页面访问地址,填写服务器的ip即可,如果不填写,那么kibana启动后默认只能使用localhost访问,不能进行远程访问。
我们这里是演示环境,因此这里我只配置了这两项,具体实际根据根据实际应用进行配置即可。完整的配置文件内容如下:
# Kibana is served by a back end server. This setting specifies the port to use.
#server.port: 5601

# Specifies the address to which the Kibana server will bind. IP addresses and host names are both valid values.
# The default is 'localhost', which usually means remote machines will not be able to connect.
# To allow connections from remote users, set this parameter to a non-loopback address.
server.host: "192.168.31.20"

# Enables you to specify a path to mount Kibana at if you are running behind a proxy.
# Use the `server.rewriteBasePath` setting to tell Kibana if it should remove the basePath
# from requests it receives, and to prevent a deprecation warning at startup.
# This setting cannot end in a slash.
#server.basePath: ""

# Specifies whether Kibana should rewrite requests that are prefixed with
# `server.basePath` or require that they are rewritten by your reverse proxy.
# This setting was effectively always `false` before Kibana 6.3 and will
# default to `true` starting in Kibana 7.0.
#server.rewriteBasePath: false

# The maximum payload size in bytes for incoming server requests.
#server.maxPayloadBytes: 1048576

# The Kibana server's name.  This is used for display purposes.
#server.name: "your-hostname"

# The URLs of the Elasticsearch instances to use for all your queries.
elasticsearch.hosts: ["http://192.168.31.20:9200"]

# When this setting's value is true Kibana uses the hostname specified in the server.host
# setting. When the value of this setting is false, Kibana uses the hostname of the host
# that connects to this Kibana instance.
#elasticsearch.preserveHost: true

# Kibana uses an index in Elasticsearch to store saved searches, visualizations and
# dashboards. Kibana creates a new index if the index doesn't already exist.
#kibana.index: ".kibana"

# The default application to load.
#kibana.defaultAppId: "home"

# If your Elasticsearch is protected with basic authentication, these settings provide
# the username and password that the Kibana server uses to perform maintenance on the Kibana
# index at startup. Your Kibana users still need to authenticate with Elasticsearch, which
# is proxied through the Kibana server.
#elasticsearch.username: "kibana"
#elasticsearch.password: "pass"

# Enables SSL and paths to the PEM-format SSL certificate and SSL key files, respectively.
# These settings enable SSL for outgoing requests from the Kibana server to the browser.
#server.ssl.enabled: false
#server.ssl.certificate: /path/to/your/server.crt
#server.ssl.key: /path/to/your/server.key

# Optional settings that provide the paths to the PEM-format SSL certificate and key files.
# These files are used to verify the identity of Kibana to Elasticsearch and are required when
# xpack.security.http.ssl.client_authentication in Elasticsearch is set to required.
#elasticsearch.ssl.certificate: /path/to/your/client.crt
#elasticsearch.ssl.key: /path/to/your/client.key

# Optional setting that enables you to specify a path to the PEM file for the certificate
# authority for your Elasticsearch instance.
#elasticsearch.ssl.certificateAuthorities: [ "/path/to/your/CA.pem" ]

# To disregard the validity of SSL certificates, change this setting's value to 'none'.
#elasticsearch.ssl.verificationMode: full

# Time in milliseconds to wait for Elasticsearch to respond to pings. Defaults to the value of
# the elasticsearch.requestTimeout setting.
#elasticsearch.pingTimeout: 1500

# Time in milliseconds to wait for responses from the back end or Elasticsearch. This value
# must be a positive integer.
#elasticsearch.requestTimeout: 30000

# List of Kibana client-side headers to send to Elasticsearch. To send *no* client-side
# headers, set this value to [] (an empty list).
#elasticsearch.requestHeadersWhitelist: [ authorization ]

# Header names and values that are sent to Elasticsearch. Any custom headers cannot be overwritten
# by client-side headers, regardless of the elasticsearch.requestHeadersWhitelist configuration.
#elasticsearch.customHeaders: {}

# Time in milliseconds for Elasticsearch to wait for responses from shards. Set to 0 to disable.
#elasticsearch.shardTimeout: 30000

# Time in milliseconds to wait for Elasticsearch at Kibana startup before retrying.
#elasticsearch.startupTimeout: 5000

# Logs queries sent to Elasticsearch. Requires logging.verbose set to true.
#elasticsearch.logQueries: false

# Specifies the path where Kibana creates the process ID file.
#pid.file: /var/run/kibana.pid

# Enables you specify a file where Kibana stores log output.
#logging.dest: stdout

# Set the value of this setting to true to suppress all logging output.
#logging.silent: false

# Set the value of this setting to true to suppress all logging output other than error messages.
#logging.quiet: false

# Set the value of this setting to true to log all events, including system usage information
# and all requests.
#logging.verbose: false

# Set the interval in milliseconds to sample system and process performance
# metrics. Minimum is 100ms. Defaults to 5000.
#ops.interval: 5000

# Specifies locale to be used for all localizable strings, dates and number formats.
# Supported languages are the following: English - en , by default , Chinese - zh-CN .
#i18n.locale: "en"
3、添加用户组权限
kibana和elasticsearch一样,不允许使用root账户运行,如果当前我们没有使用root用户配置,则此环节忽略掉,下面介绍下切换用户
useradd es   #添加一个名叫es的用户

chown -R es.es kibana-7.7.0-linux-x86_64/config/    #把kibana文件夹的权限授权给es这个用户

su es  #切换到es这个用户下
4、启动kibana
启动比较简单,直接进入到kibana的bin目录下执行下启动命令即可。
cd /mnt/kibana-7.7.0-linux-x86_64/bin/

./kibana
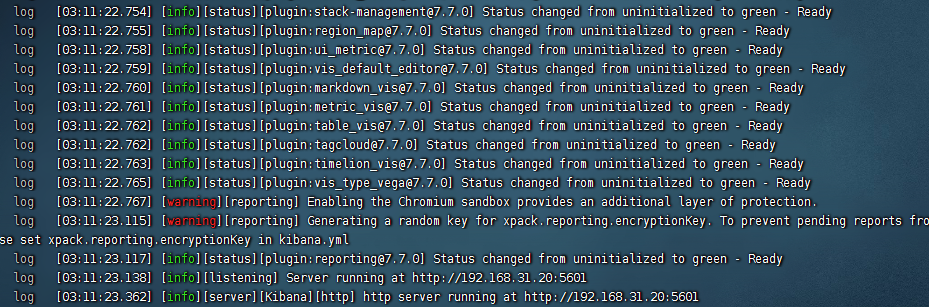
然后等待页面出现:[listening] Server running at http://192.168.31.20:5601 这种提示就代表kibana启动完成了。
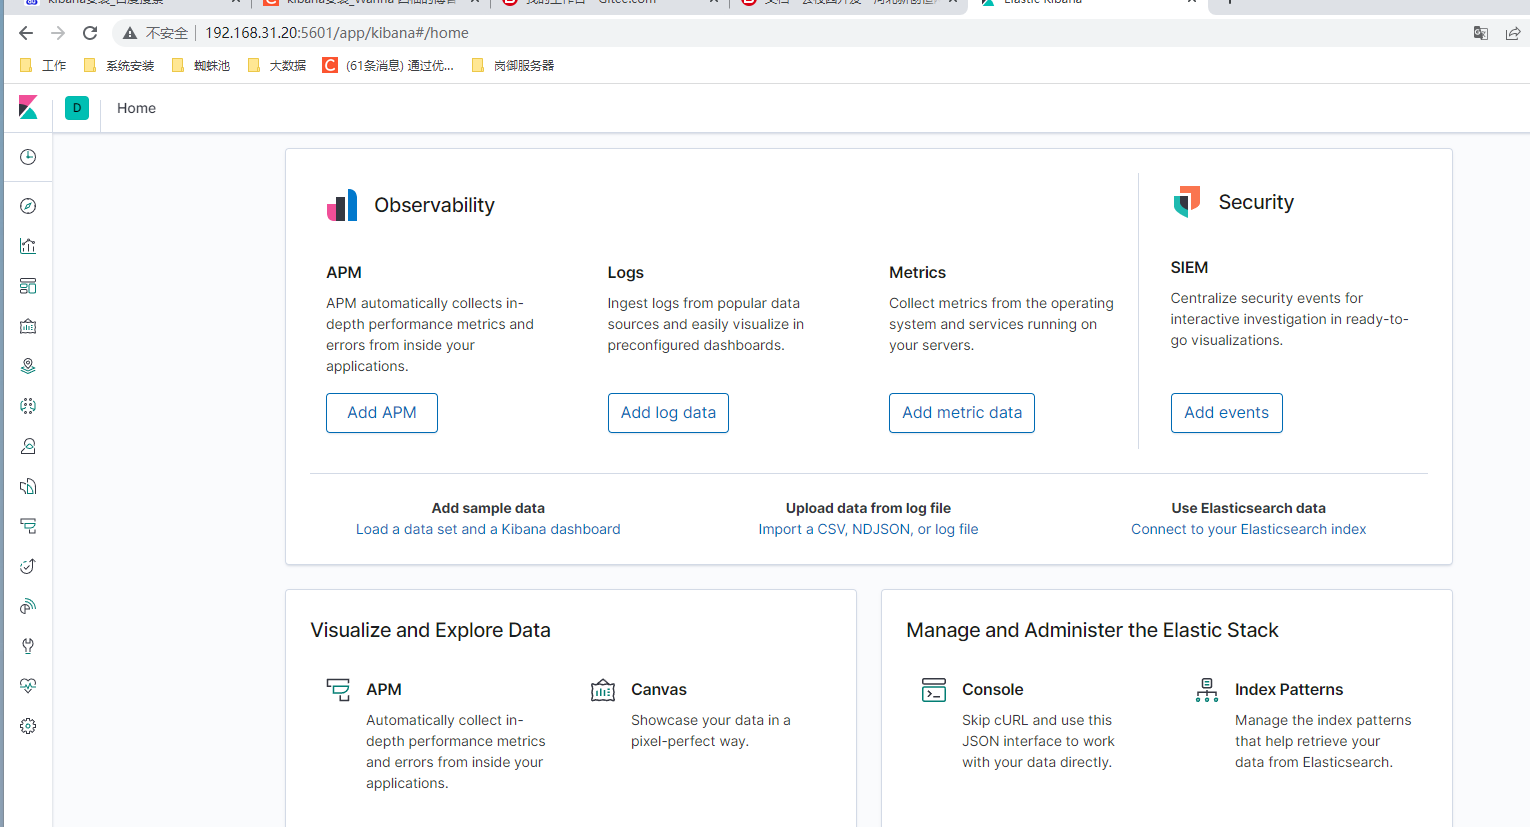
此时我们访问下192.168.31.20:5601即可看到kibana的页面
备注:这里我们使用
./kibana
上面的命令启动kibana的话,如果ssh客户端关闭后,则kibana也会停止,因此如果我们需要kibana长时间启动的话,则可以使用如下命令:
nohup ./kibana &
这样子即使我们关闭ssh客户端,kibana也是在正常运行着的。
四、测试搜索
上面我们已经可以正常访问kibana了,接下来我们使用kibana进行搜索。
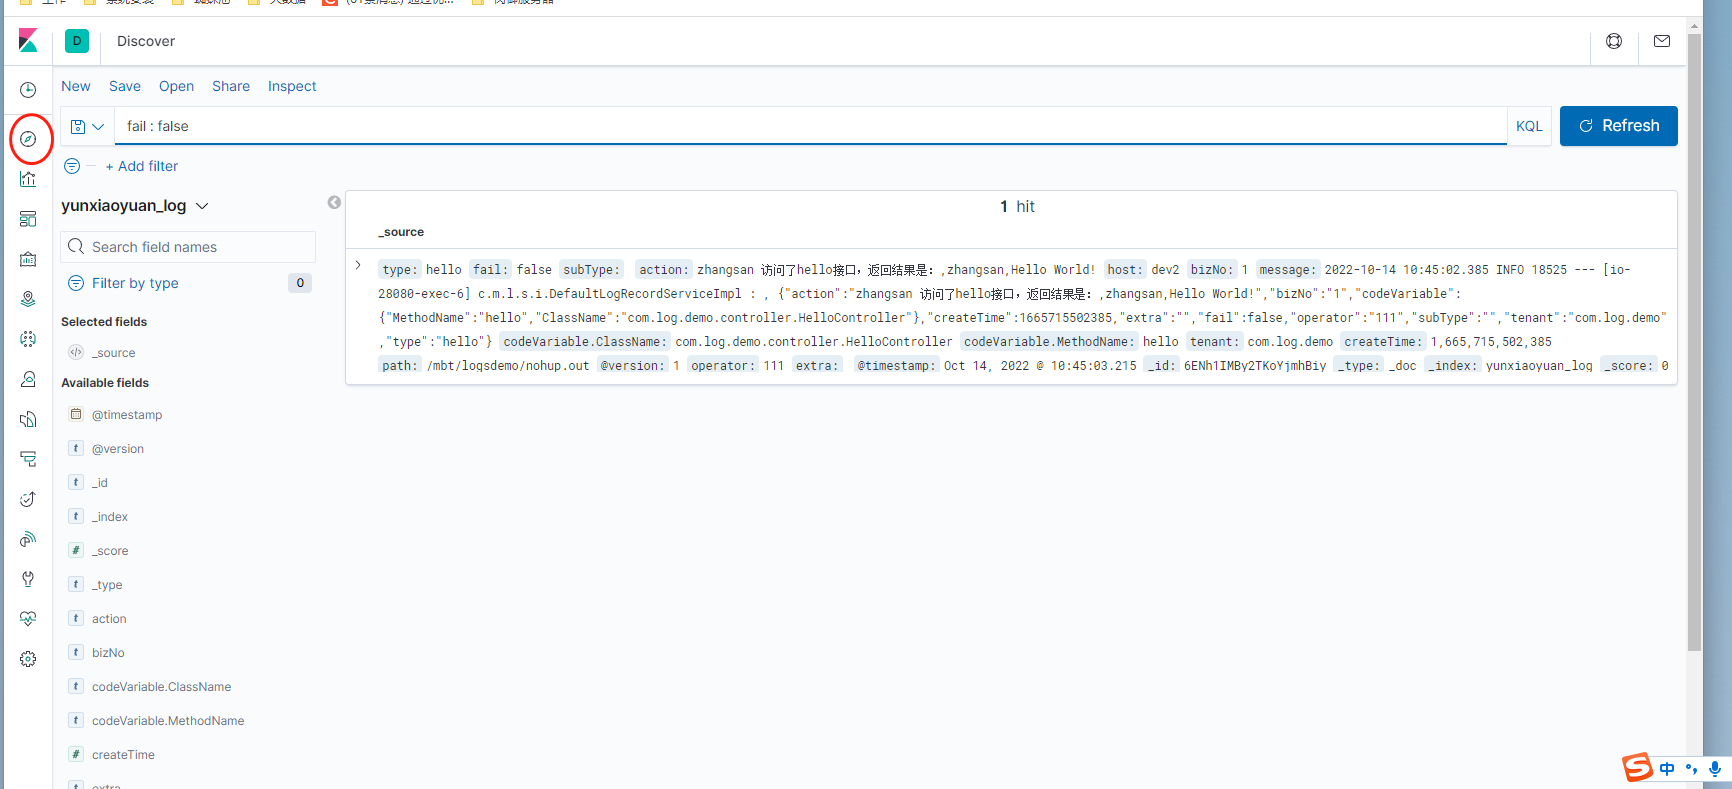
点击左侧第二个图标即可进入到索引的界面,这里我们可以看到所有的日志,我们可以直接在上面的搜索框里根据我们的搜索字段进行搜索即可。具体的使用方法大家安装一个kibana即可体验到结果。


还没有评论,来说两句吧...